Where The US Gets Its Oil: Visualizing 20 Years Of US Oil Import Data (1996-2015)


US oil imports are rising for the first time in a decade.
Between 2006 and 2015, increased domestic production, combined with lower demand, lead to a steady decline in net US oil imports. Indeed, from a peak net import of 12,549,000 barrels per day in 2005, net import bottomed out at an average of just 4,651,000 barrels per day in 2015.
 However, US oil production is now falling – currently standing at around 8,825,000 barrels per day. This is down 860,000 barrels from peak production levels seen in April 2015.
Demand is also increasing. Cheap gasoline has lead to a resurgence in US fuel consumption – with usage hitting 9.2 million barrels per day in February 2016.
Of course this increased demand, coupled with lower production, means that the US is having to once again increase its oil imports.
With this in mind, we wanted to take a look at where the US imports its oil from – currently and historically. We collected data from the US Energy Information Administration, covering the last 20 years (1996-2015) and produced a series of maps and charts to illustrate our findings.
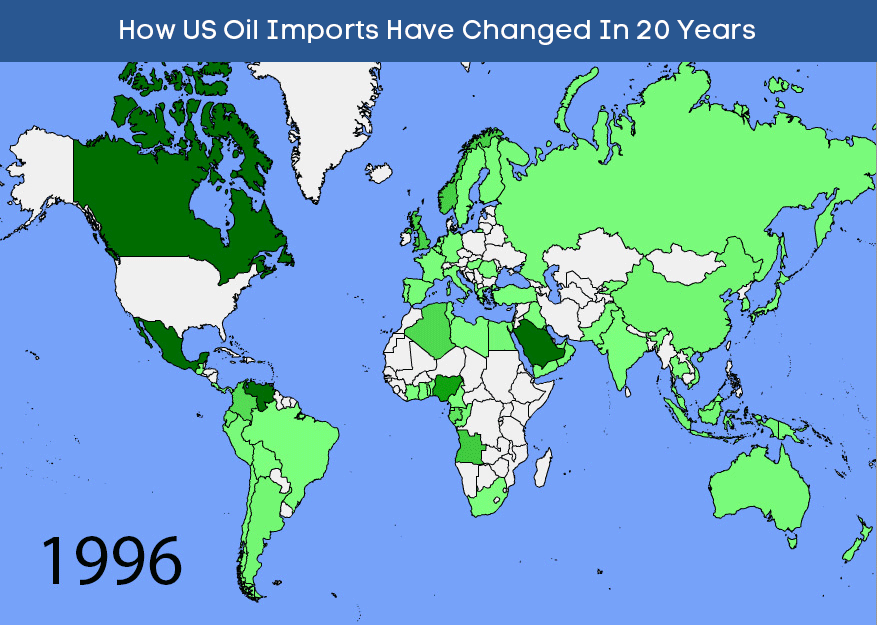
We will start with this animated global heat map, which gives a quick visual overview of how US oil imports have changed over the years. The darker shades of green show the highest exporters of oil to the US.

The map below shows just the years 1996 and 2015 – giving an at a glance overview of how US oil imports have changed in the past 20 years.
US Oil Imports By Continent
Next we’ll look at some more specific data. The chart below shows US oil imports by continent (in thousands of barrels). Click a year to see how imports have changed and hover over a barrel to see the figures.
US Oil Imports By Country
Now let’s look at oil imports from specific countries. For simplicity we have split this section into continents. There are two charts for each continent. The first gives a quick ‘size’ comparison of the amount of oil imported from each country (viewable by year and limited to the top 10 countries for that year), while the second shows how imports have risen and fallen over the period from all countries.
Top 5 Exporters Of Oil To The US (by year)
Now let’s take a look at the top 5 exporters of oil to the US for each year. Interestingly, while the order changes, the top 5 countries remained consistent between 1996 and 2011:
- Canada
- Mexico
- Nigeria
- Saudi Arabia
- Venezuela
After 2011, Nigeria dropped out the top 5 and was replaced by Russia (2012,2013), Iraq (2014) and Colombia (2015).
Top 10 Exporters Of Oil To The US (total)
And finally here are the totals for the top 10 exporters of oil to the US over the entire 20 year period:
Please feel free to share the charts on your own site using the embed codes above. For press enquiries, quotes, or questions on methodology, please email [email protected].
Embed This Image On Your Site (copy code below):